
Advances Using Remote Sensing Data to Map Forest Disturbances
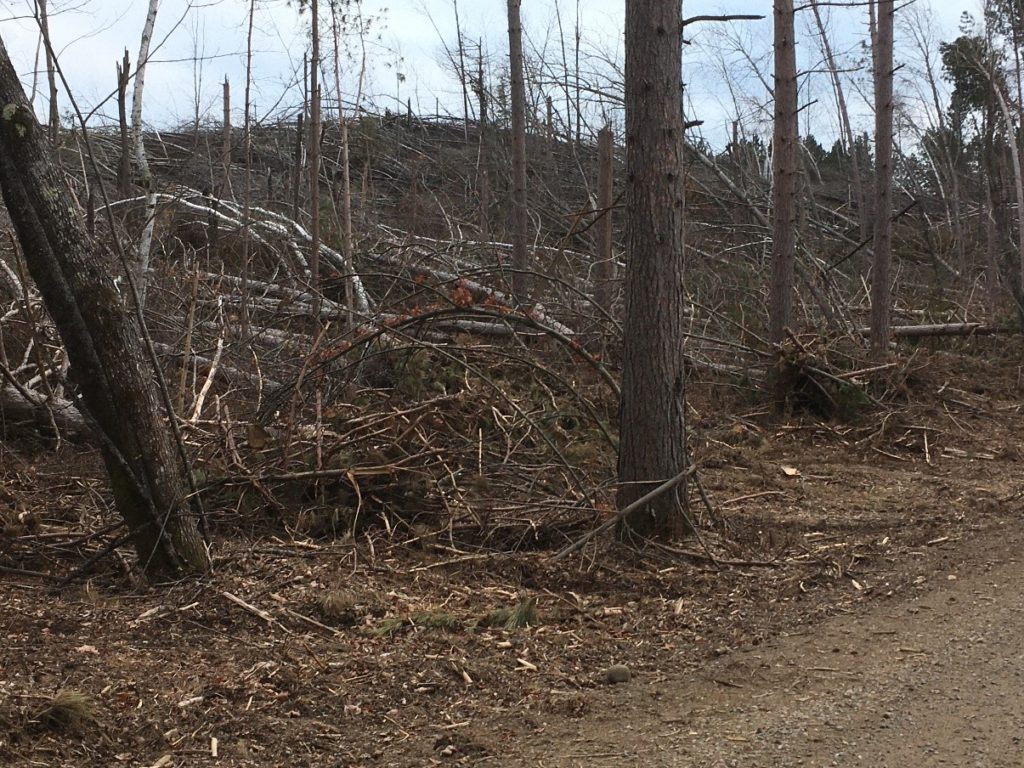
Whole stands of trees were blown flat by the derecho that hit Wisconsin in 2019.
Written by Sarah Wegmueller, Townsend Lab, University of Wisconsin, Madison
In July 2019, thousands of acres of trees in the Chequamegon-Nicolet National Forest blew down in a 100-year storm. Salvage efforts had to start somewhere, but where? District silviculturist John Lampereur desperately needed help mapping the extensive damage, and the normal resources were already overwhelmed. I thought there had to be a better way, given newly available remote sensing data and techniques on the scene.
For years, the most prominent mapping tool was ForWarn, a web-based mapping tool that allows users to locate areas of high change. This is a wonderful system that uses the MODIS satellite data, with new imagery available daily. The trade-off with that timely delivery though, is that the spatial resolution is very course – pixel sizes of 250 meters (about 820.21 ft) It is difficult to draw the precise boundaries that salvage harvests require using only ForWarn’s maps.
The satellite imagery seen on Google Maps is neither widespread nor prevalent. That imagery is costly to collect and is generally not updated frequently. The satellites that collect the imagery often seen in Google Maps or news stories are usually not the same satellites scientists can use for mapping forest disturbances on an operational scale.
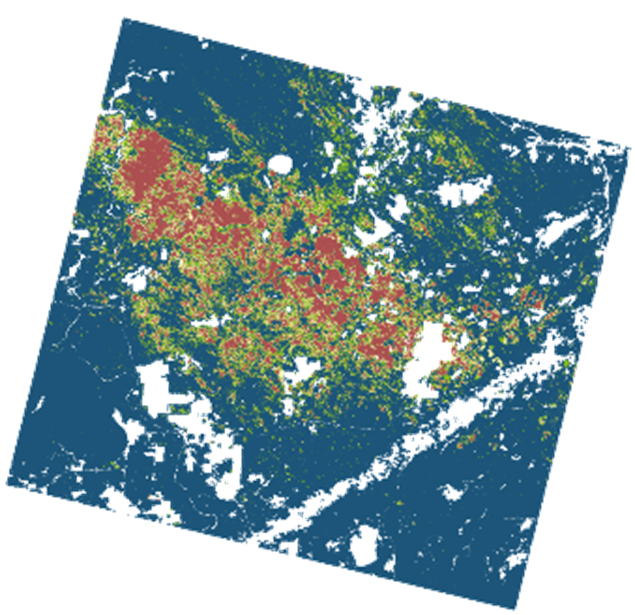
Astrape map of the derecho damage in the Chequamegon-Nicolet National Forest.
Fortunately, the inventory of satellites producing data that can be used has greatly expanded in the past decade. Even better, this has occurred at the same time our computational resources and machine learning modeling skills are improving by leaps and bounds. In short, new doors are open to us that we’re still exploring. Not a moment too soon, either, as climate change drives storms to increase in severity and COVID-19 kept many forestry professionals out of the field for an entire growing season.
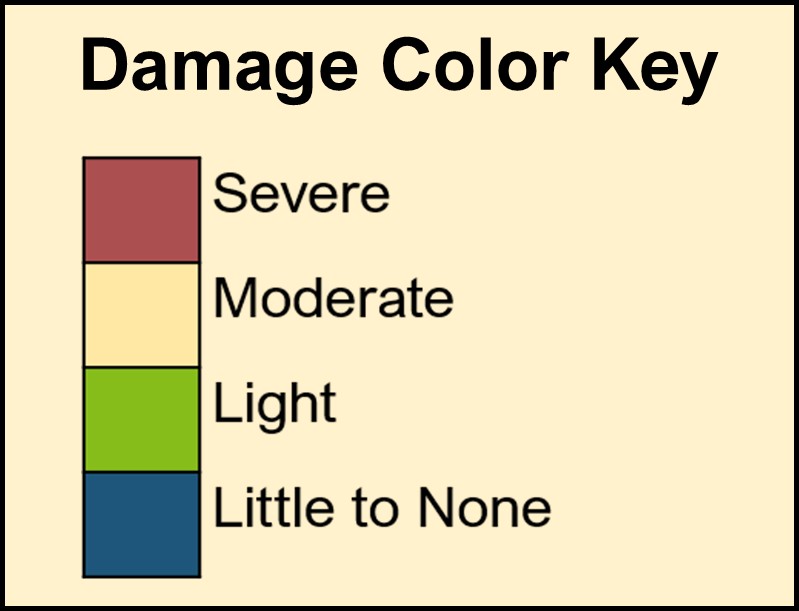
Color key for damage map
Watching John struggle galvanized me to create a system capable of mapping severe damage using satellite imagery with a spatial resolution of 3 to 10-meter pixels, data that only became available in 2016. I call this system Astrape and it has since been used to map tornados, wildfires, hurricane damage, and spongy moth defoliation. But it was not the only system created in response to such a need. Concurrently, HiForm was also developed to map severe disturbances and uses the Google Earth Engine platform. Other systems would follow, including at least two systems that use NAIP imagery with a resolution of less than 1 meter and that can map things like oak wilt and emerald ash borer mortality (TCH, and TreeCAP, pending publication).
Many of the systems from this new cohort are available to use now, but the word is still getting out about their existence. To be clear, none of these new tools are meant to replace professionals on the ground. However, they greatly reduce the mapping struggles like those John faced and highlight the areas where forestry professionals may want to focus their limited time. In other words, they are “force multipliers.” And they will only get better.
My research applications explore continued improvements and accessibility of these tools. Astrape is also mentioned in the Guild’s spring 2023 Forest Steward magazine (coming soon), and later this year I intend to share more. I hope that it is useful for the Guild community and other stewards creatively working to keep up with novel and challenging times.